Visualize
Golden Dragon Algo helps you clearly see the prevailing trend and early shifts in momentum, so you can make more confident decisions about when to enter or exit trades.
View PlansDouble Cloud
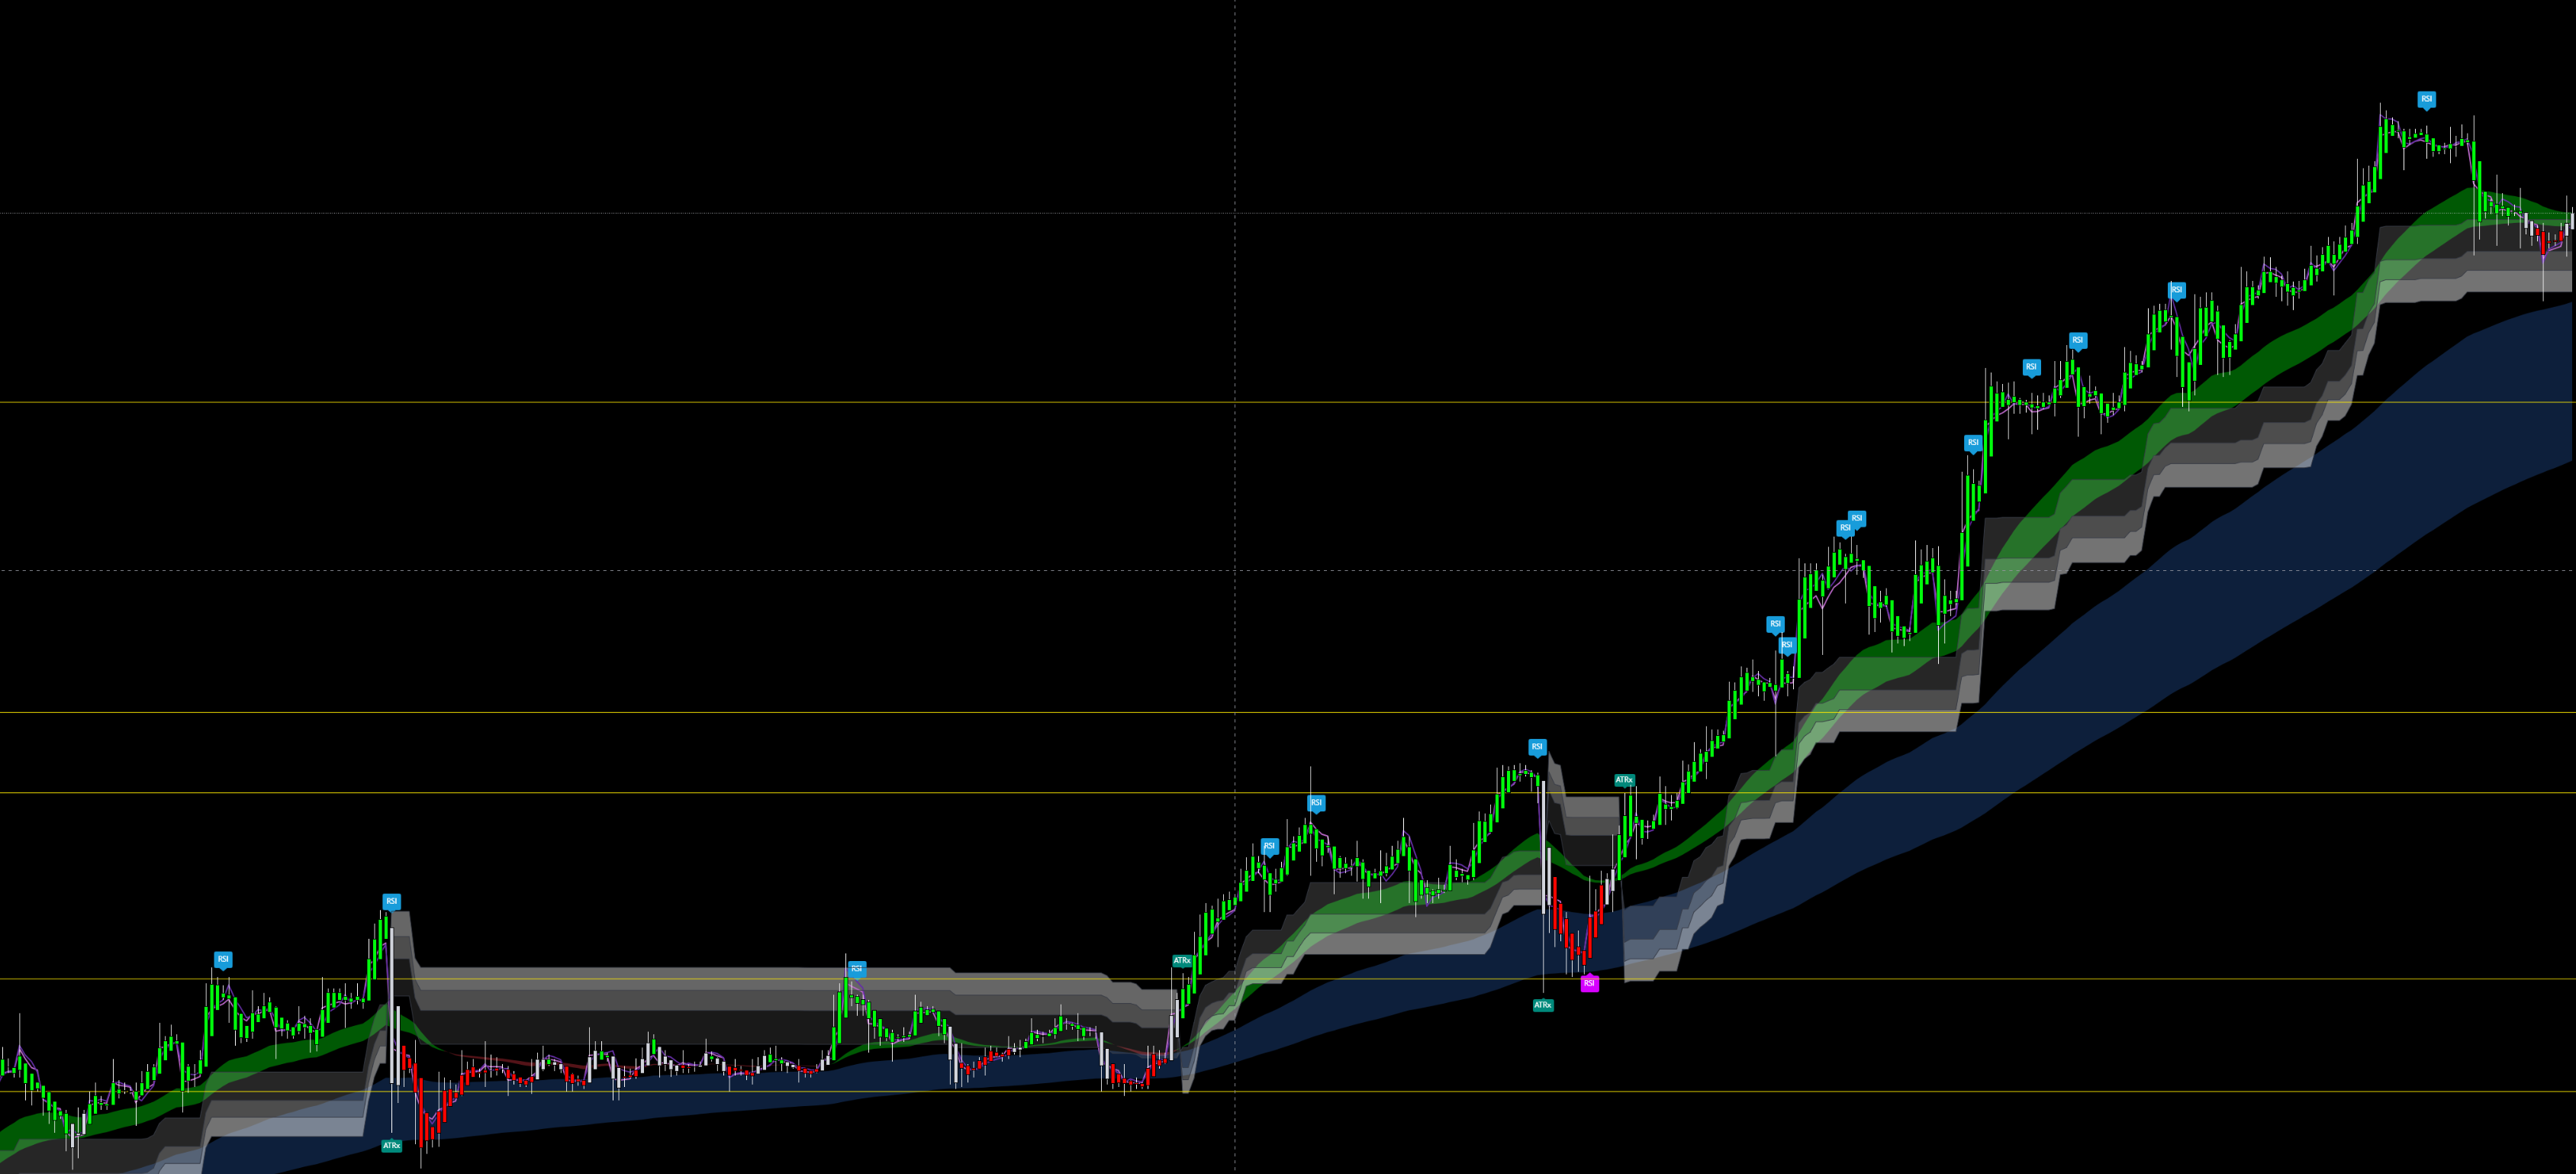
Our double EMA clouds highlight short‑ and long‑term trend structure, making it easier to spot strong directional moves when both clouds are in agreement.
View PlansDouble Cloud Flags
Optional bullish and bearish flags call out key crossovers and transitions, providing clear visual cues when market conditions are changing.
View PlansAlgo Painter
Algo Painter dynamically colors bars as conditions shift, helping you see trend continuation and potential reversals at a glance.
View PlansBottom/Top Trend Breaker
Adaptive top and bottom bands track price and act as dynamic support and resistance, highlighting when structure breaks and trend direction may be changing.
View PlansDashboard
We offer an optional dashboard that surfaces the current signals from key Golden Dragon Algo tools, making it easier to quickly see the prevailing trend of an asset at a glance.
View PlansPlus MORE!
Golden Dragon Algo also gives you a full suite of advanced tools that work together to clarify structure, momentum, and key decision levels—so you can trade with more confidence and less guesswork.
- Auto Support/Resistance – Automatically plots major support and resistance zones for you, with an option to increase the number of levels when you want an even bigger-picture view of the market.
- Channel Lines – Built‑in channels help reveal potential areas of support, resistance, and breakout as price moves within or outside the channel.
- Linear Regression – Adds another perspective on trend and structure, highlighting areas where price may react or break away from the prevailing move.
- Auto Fibonacci – Automatically draws popular Fibonacci retracement levels so you can quickly spot zones where price may pause, reverse, or accelerate.
- EMA & VWAP – Easily overlay key EMAs and VWAP to round out your view of trend, mean reversion, and intraday context.
All of this is built into one streamlined Golden Dragon Algo package—plus access to new indicators and enhancements we’re actively developing.
All Together
Each component of Golden Dragon Algo is designed to be powerful on its own, and even more effective when combined. You can enable the tools that fit your trading style and hide the rest.
Staying on the right side of the trend can make a meaningful difference in your results. Our goal is to give you a clear, structured view of price action so you can focus on execution instead of staring at noisy charts.
Seize the Deal: Unbeatable Offer Inside!

See Our Indicator In Action
Watch a walkthrough of Golden Dragon Algo on live charts and see how the tools work together inside TradingView.
* Any offer or banner that includes an asterisk ("*") is limited to new paid subscribers placing their first successful order, and may not be available to previous or existing subscribers.
